PART III: FINANCIAL ANALYSIS
CONFIDENTIAL - For Board Review Only
Investment Breakdown: $3.5M
Machinery Investment: €1.8M ($1.95M)
Capital equipment for dual chocolate and coffee production capabilities, sourced from leading European equipment manufacturers with proven UAE installation experience.
| Equipment Category | Supplier | Capacity | Investment (EUR) | Lead Time |
|---|---|---|---|---|
| Chocolate Processing Line | Bühler Group (Switzerland) | 500 kg/hour | €1,100,000 | 6-9 months |
| Coffee Roasting System | Loring Smart Roast (USA) | 60 kg/batch | €450,000 | 4-6 months |
| Packaging Equipment | Bosch Packaging (Germany) | 30 units/min | €150,000 | 3-5 months |
| Quality Control Lab | Agilent Technologies | Full testing suite | €100,000 | 2-3 months |
| TOTAL MACHINERY | - | - | €1,800,000 | 6-9 months (critical path) |
Operations Investment: $1.7M
Facility establishment, regulatory compliance, working capital, and professional services required for operational readiness.
- Legal & Entity Formation: $120k
- Machinery Deposit: $585k (30%)
- Facility Design: $30k
- Financing Fees: $15k
- EUR/AED Hedging: $22k
- ERP Planning: $5k
- Contingency: $43k
- Rebranding Agency: $200k
- Facility Construction: $130k
- ERP Deployment: $20k
- Staffing & Recruitment: $40k
- Supplies & Misc: $25k
- Construction Completion: $200k
- Interim Product Sourcing: $80k
- Compliance Docs: $60k
- Staff Training: $40k
- HORECA Activation: $25k
- Interim Lease: $15k
- Contingency: $50k
Working Capital Allocation: $700k
- Raw Material Inventory (3 months): $280k (Cocoa $120k, Coffee $100k, Secondary $60k)
- Finished Goods Inventory (45 days): $120k
- Accounts Receivable Buffer (NET 30-45): $200k
- Operating Expense Reserves (2 months): $100k
Financing Strategy
Emirates Development Bank Financing
Loan Amount: $1.3M for machinery at 3-5% interest (50% below commercial rates)
Terms: 5-7 year repayment with 12-month grace period
Equity Contribution: $2.2M from Parmida company resources
Debt Service: Year 2-6 annual payments ~$280k (easily covered by projected cash flows)
Revenue Model
Product Portfolio Strategy
Balanced chocolate and coffee products across multiple price points and channels, optimizing for margin, volume, and strategic positioning.
| Product Category | Revenue (Yr 3) | % Mix | Gross Margin | Key Drivers |
|---|---|---|---|---|
| Dark Chocolate (60-96%) | $9.2M | 45% | 48% | Premium positioning, health trends, gift market |
| Specialty Coffee | $5.1M | 25% | 42% | HORECA dominance, freshness advantage |
| Chocolate Spreads & Dragees | $3.1M | 15% | 38% | Volume products, retail distribution |
| Couverture B2B | $2.0M | 10% | 35% | Bakery/pastry supply, consistent volume |
| Gift Sets & Premium | $1.0M | 5% | 55% | Seasonal (Ramadan, Eid), corporate gifts |
| TOTAL | $20.4M | 100% | 45% | Weighted average margin |
Unit Economics
| Product | Avg Selling Price | Variable Cost | Contribution Margin | Annual Volume (Yr 3) |
|---|---|---|---|---|
| Dark Chocolate Bar (80g) | AED 18 ($4.90) | $2.45 | $2.45 (50%) | 1.88M units |
| Coffee Beans (250g) | AED 42 ($11.45) | $6.60 | $4.85 (42%) | 445k units |
| Chocolate Spread (200g) | AED 25 ($6.80) | $4.15 | $2.65 (39%) | 456k units |
| Couverture (5kg B2B) | $58.00 | $37.70 | $20.30 (35%) | 34.5k units |
| Gift Box Premium | AED 120 ($32.70) | $14.70 | $18.00 (55%) | 30.6k units |
Cost Structure
Cost of Goods Sold (COGS) Analysis
The COGS structure reflects the dual manufacturing model with raw material costs as the dominant component. Local manufacturing provides 23-31% cost advantages vs import-dependent competitors, enabling competitive pricing with superior margins.
COGS Breakdown (Year 3: 58% of Revenue)
| Cost Category | Amount | % of Revenue | Key Drivers |
|---|---|---|---|
| Raw Materials | $8.6M | 42% | Cocoa beans, coffee beans, milk powder, sugar, packaging |
| Packaging Materials | $2.0M | 10% | Custom branded packaging, boxes, bags, labels |
| Direct Labor | $1.6M | 8% | Production staff, QC technicians (12 FTEs) |
| Utilities & Production | $1.0M | 5% | Electricity (HVAC critical), water, gas, maintenance |
| Freight & Logistics | $0.6M | 3% | Inbound shipping, cold chain, distribution |
| Total COGS | $11.8M | 58% | Gross Margin: 42% |
Raw Material Sourcing Strategy
-
Cocoa Beans:
- Ghana (40%): $18.50/kg FOB, reliability and quality consistency
- Ecuador (35%): $22.00/kg FOB, fine flavor varieties for premium products
- Ivory Coast (25%): $17.00/kg FOB, volume buffer and cost optimization
-
Coffee Beans:
- Brazil (30%): $4.20/kg FOB, base blend component
- Ethiopia (25%): $6.80/kg FOB, specialty single-origin offerings
- Colombia (25%): $5.90/kg FOB, balanced flavor profiles
- Specialty Microlots (20%): $9-15/kg FOB, premium differentiation
Operating Expenses (OpEx)
Operating expense structure reflects the scaling organization, with marketing and sales investment prioritized in Years 1-3 to build brand awareness and distribution, then moderating as market position solidifies.
| OpEx Category | Year 1 | Year 2 | Year 3 | Year 4 | Year 5 |
|---|---|---|---|---|---|
| Sales & Marketing | $0.7M (14%) | $1.7M (14%) | $2.4M (12%) | $3.1M (11%) | $3.4M (10%) |
| General & Administrative | $0.5M (10%) | $1.0M (8%) | $1.6M (8%) | $2.3M (8%) | $2.7M (8%) |
| R&D / Product Development | $0.2M (4%) | $0.4M (3%) | $0.6M (3%) | $0.9M (3%) | $1.0M (3%) |
| Total OpEx | $1.4M (28%) | $3.1M (26%) | $4.6M (23%) | $6.3M (22%) | $7.1M (21%) |
| Operating Profit | $0.2M (4%) | $2.1M (18%) | $5.8M (28%) | $9.1M (32%) | $12.5M (36%) |
Margin Evolution and Drivers
Gross margin expansion from 35% (Year 1) to 42% (Year 5) reflects operational efficiency gains, purchasing power improvements, and product mix optimization toward higher-margin premium products.
Margin Improvement Drivers
- Volume Purchasing: Raw material costs decline 8-12% through volume discounts as annual purchases exceed $8M
- Production Efficiency: Labor productivity improves 25% from Year 1 to Year 3 through experience curve
- Waste Reduction: Chocolate tempering and roasting yield improvements save 3-5% annually
- Product Mix Shift: Premium gift sets and single-origin coffee (55% margin) grow from 5% to 12% of mix
- Fixed Cost Leverage: HVAC, rent, and equipment depreciation spread over growing revenue base
Cost Advantage vs Imports
- Chocolate: 31% cost reduction vs Lindt equivalent ($3.07/kg savings)
- Coffee: 23% cost reduction vs Illy equivalent ($2.41/kg savings)
- Total NPV Benefit: $3.37M over 5 years from manufacturing advantage
- Competitive Edge: Enables premium positioning with value pricing vs imports
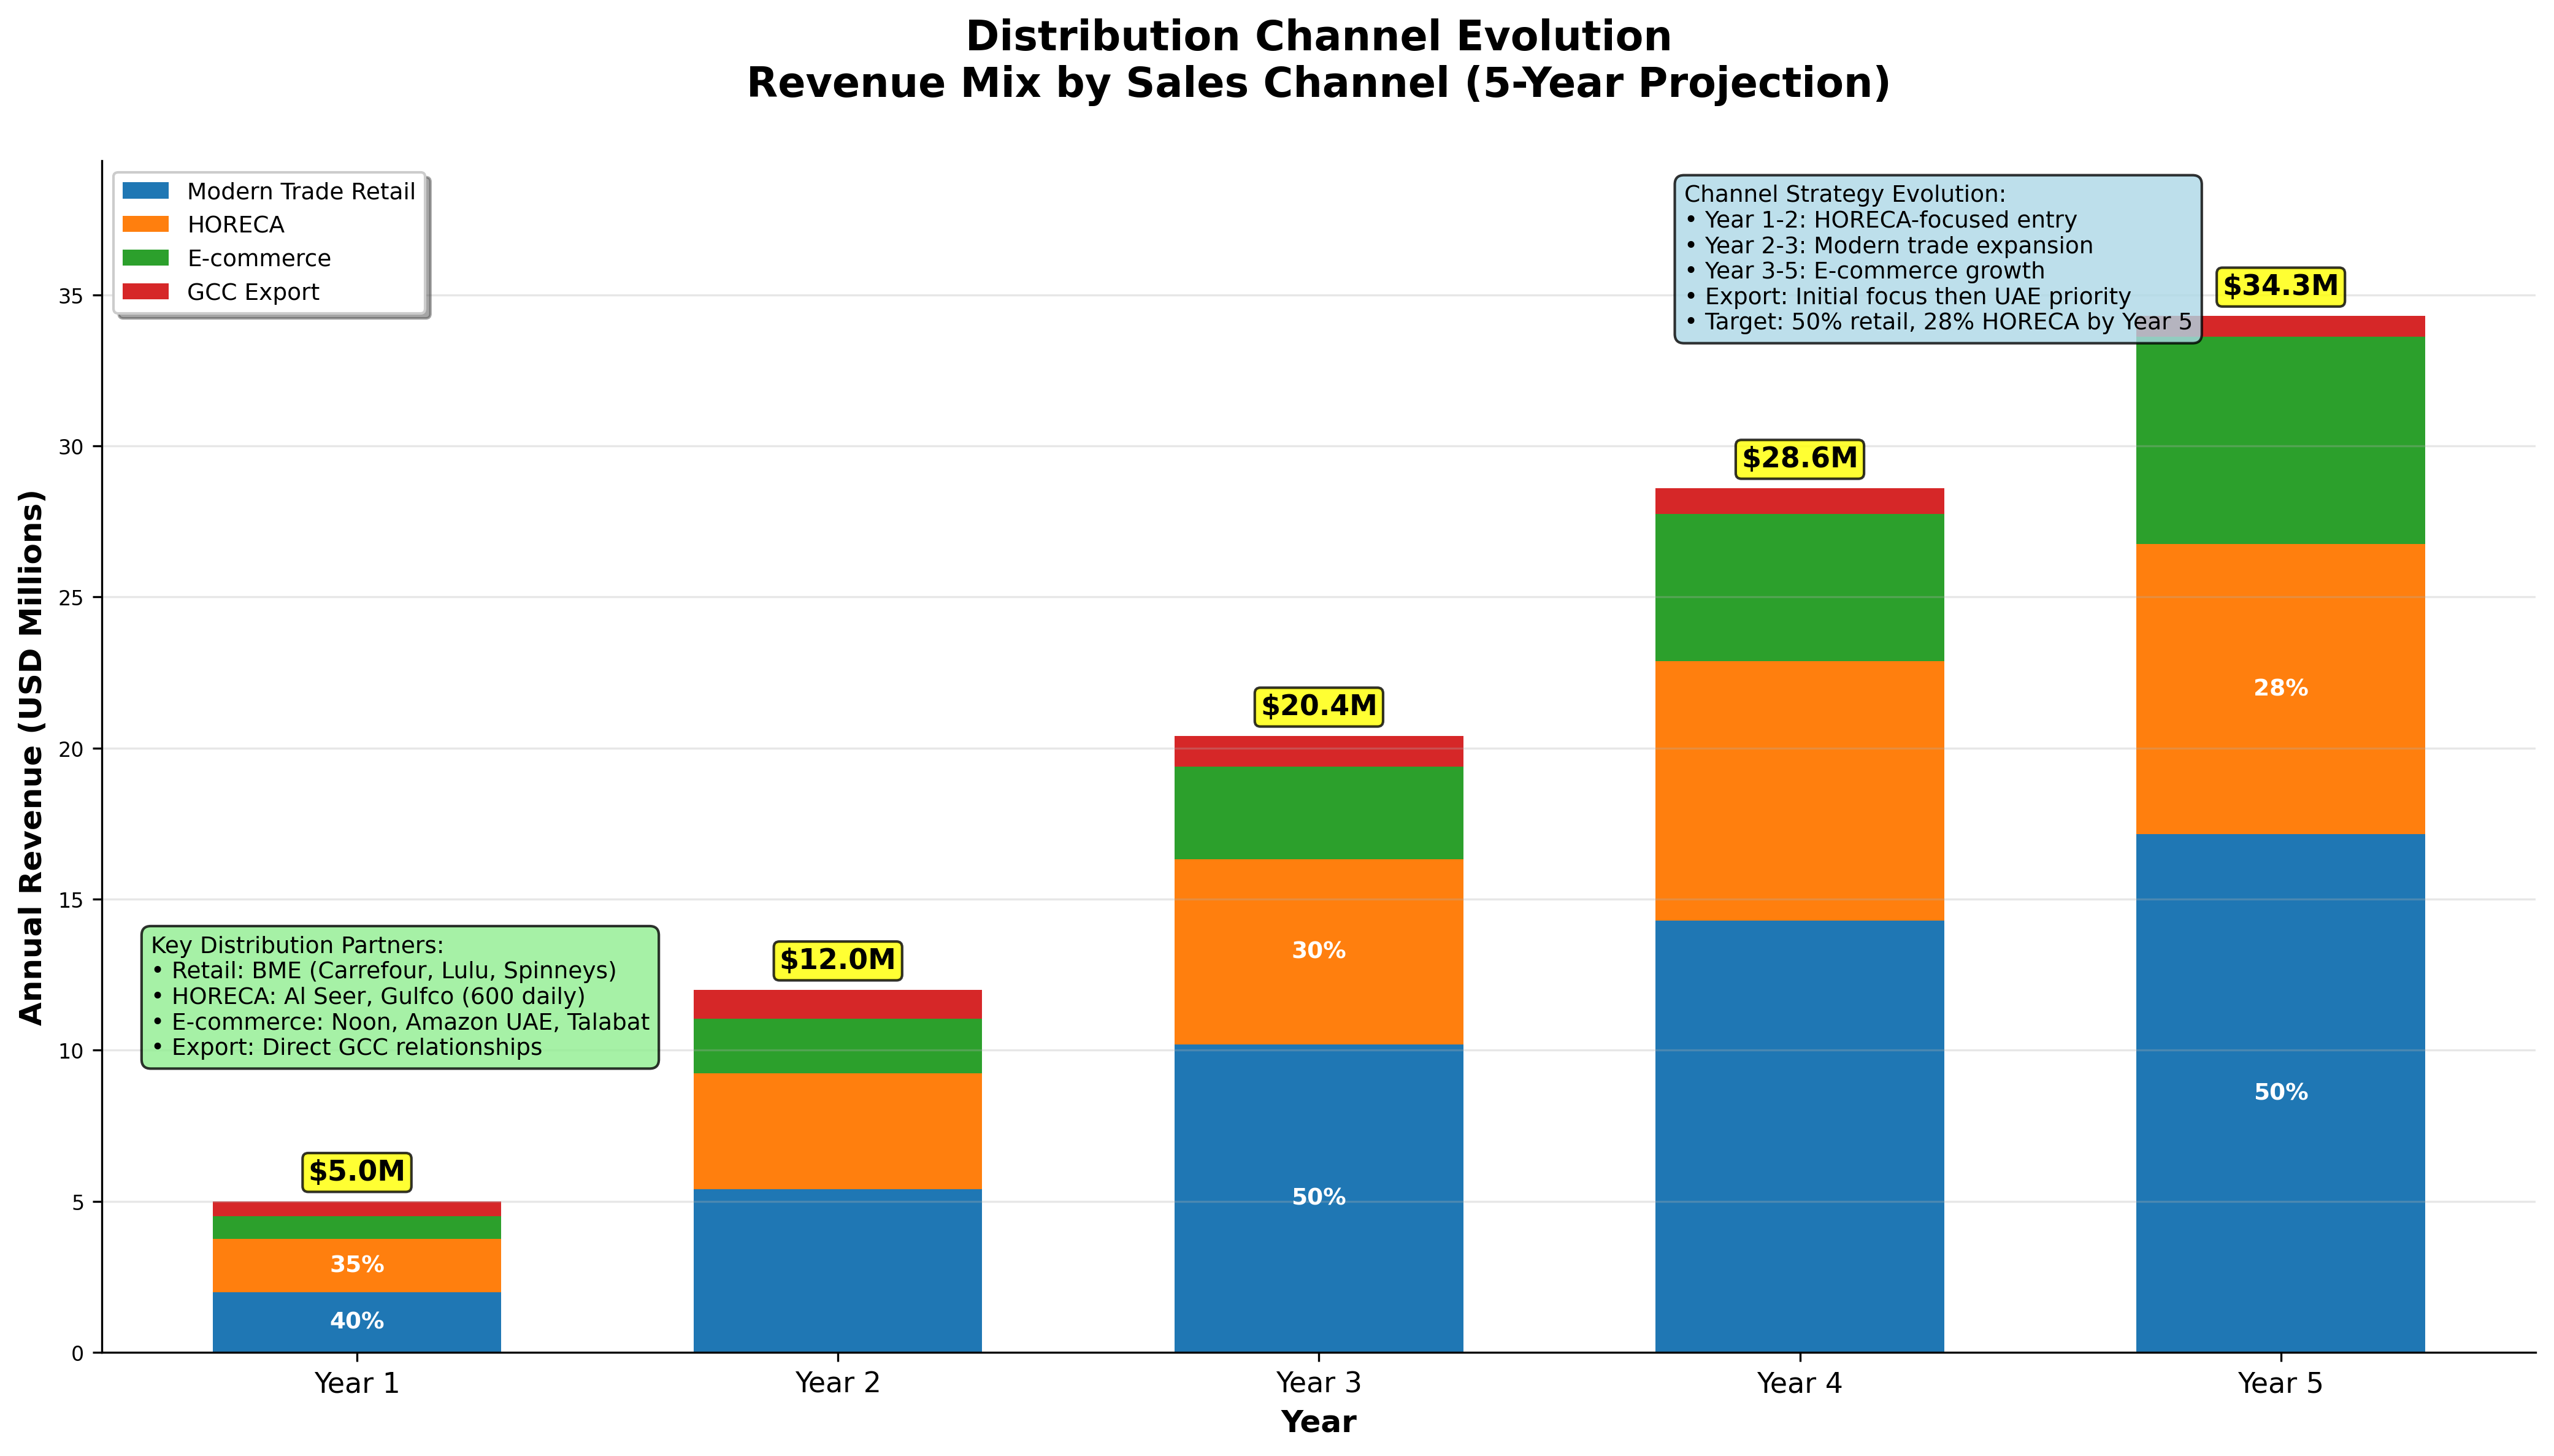
Channel Revenue Distribution
Revenue distribution across channels reflects deliberate market entry sequencing, starting with HORECA (higher margins, faster adoption) and expanding to modern retail as brand awareness builds.
5-Year Financial Projections
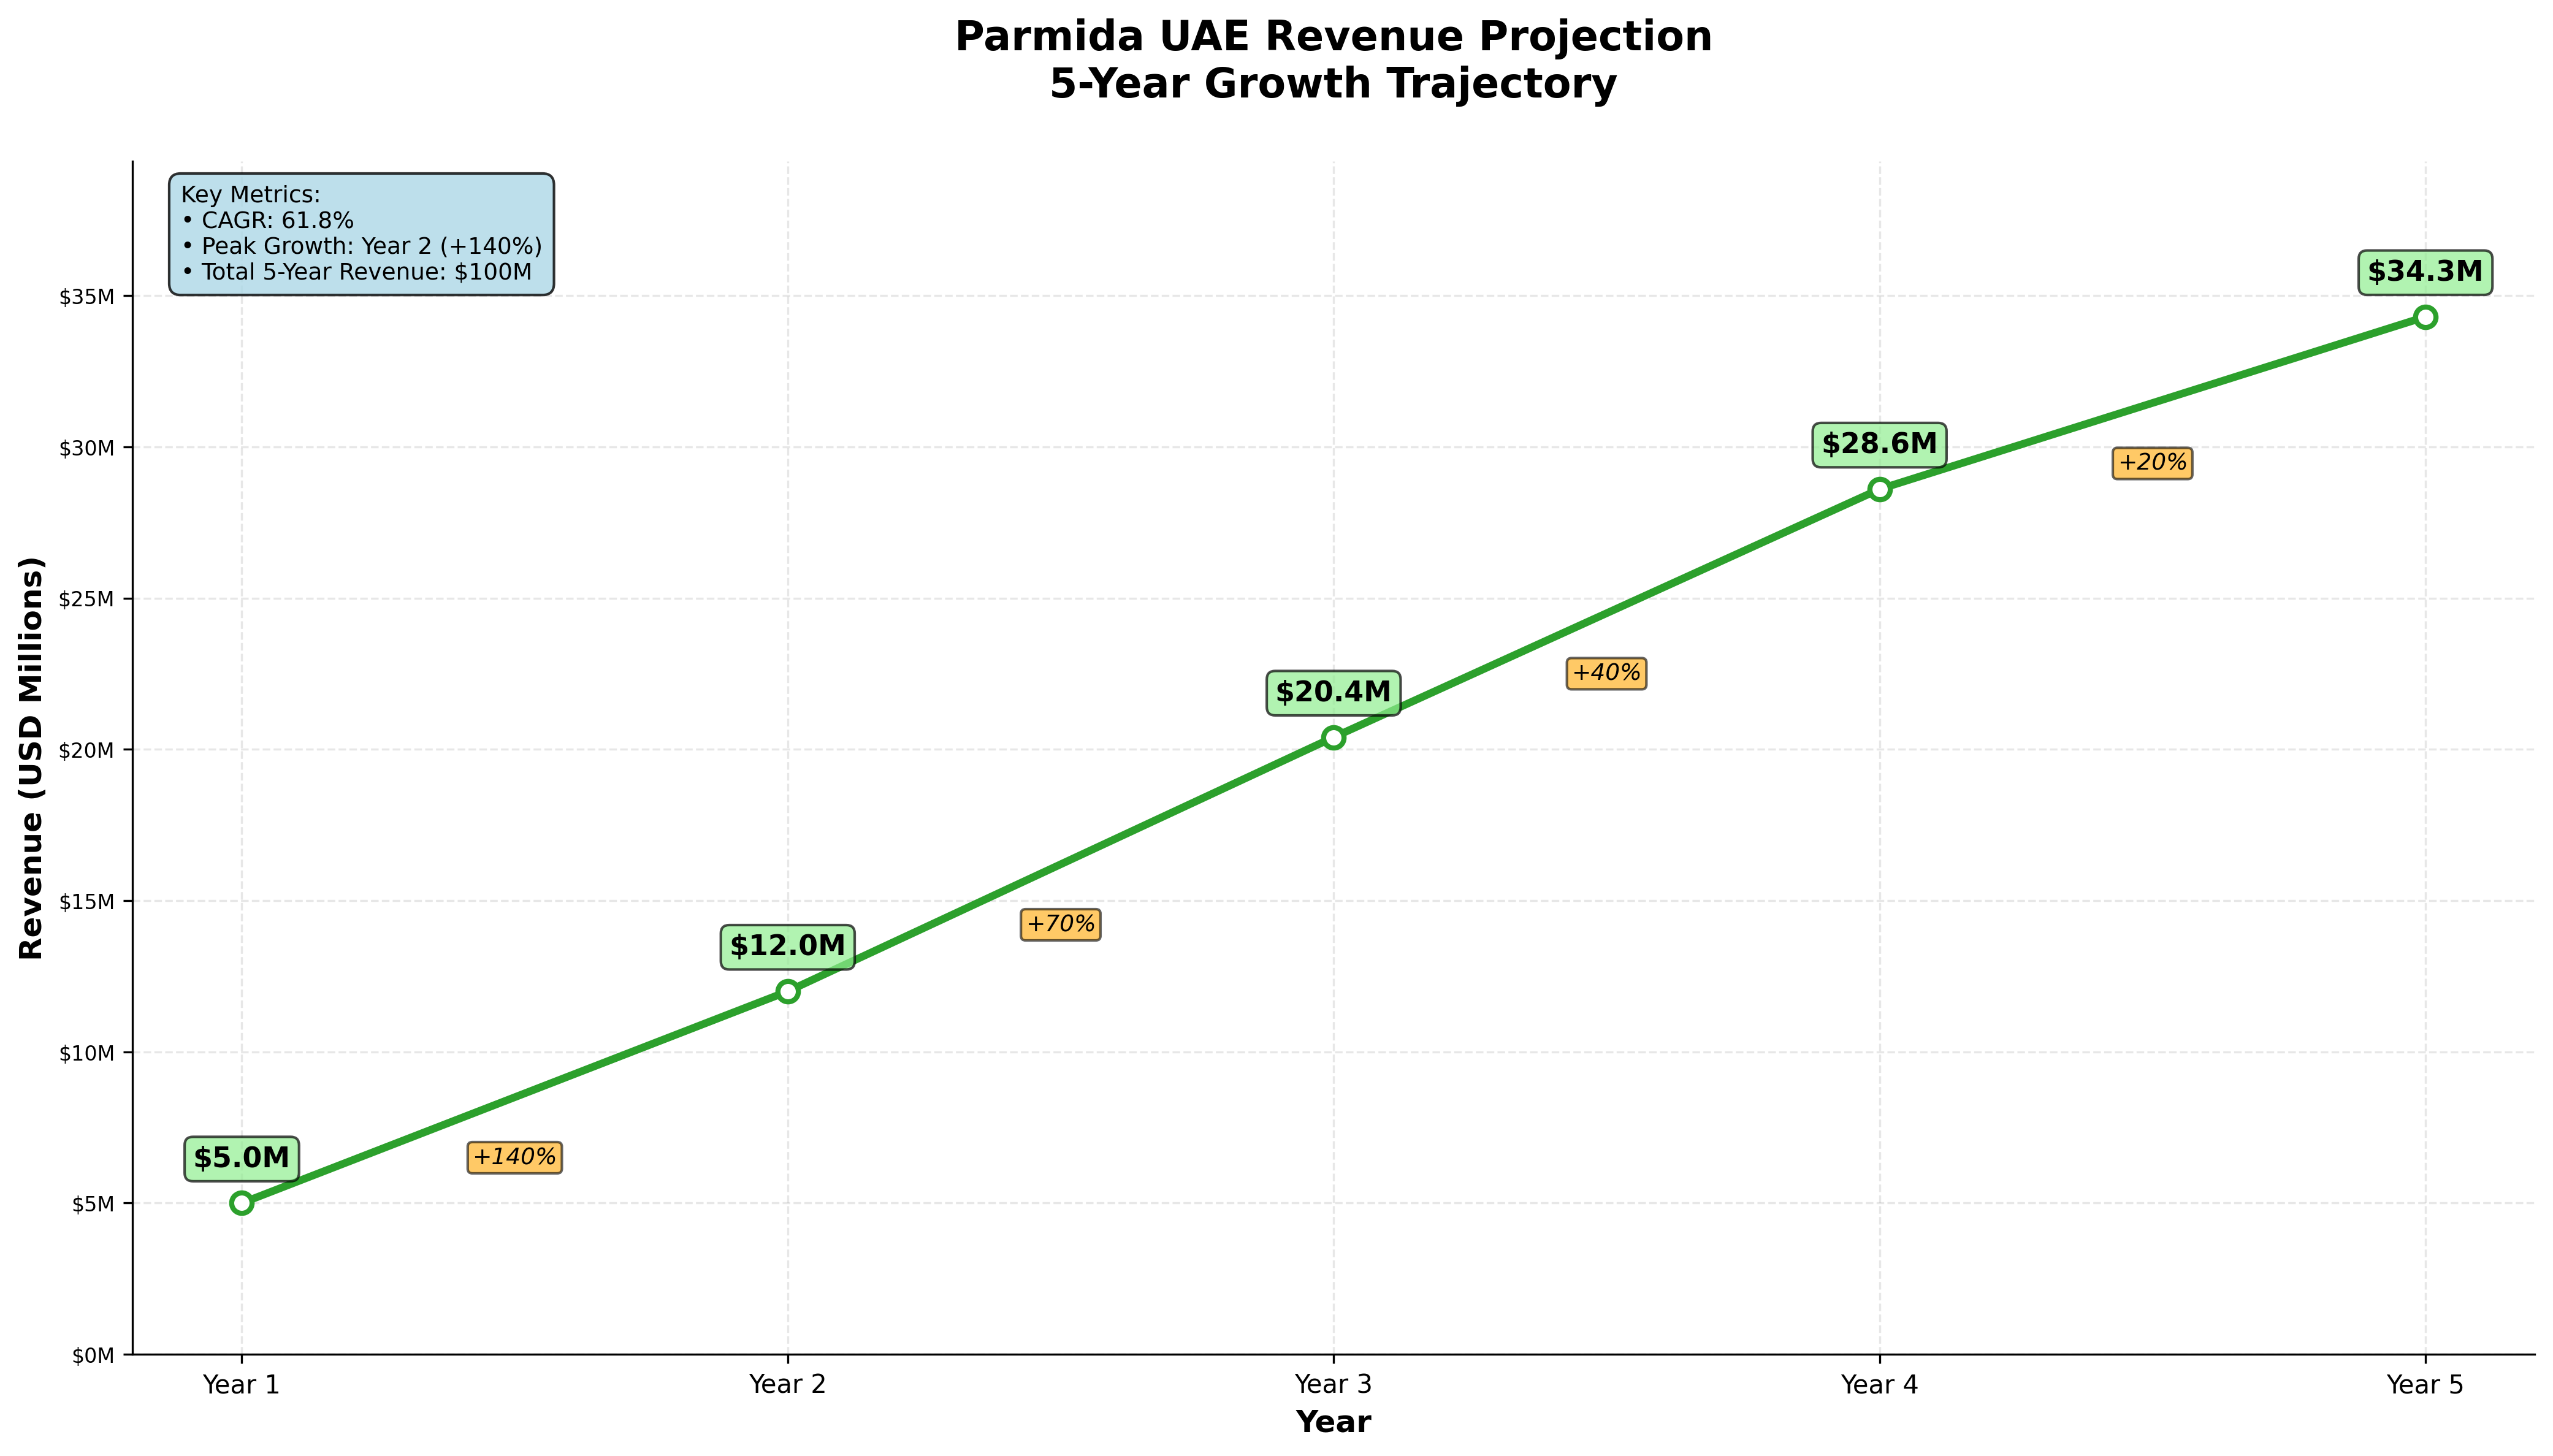
Revenue Trajectory
The revenue projection reflects conservative market penetration assumptions validated through comparable market entries and distributor feedback. Growth accelerates in Years 2-3 as production scales and brand awareness builds, then moderates in Years 4-5 as market maturity approaches.
Comprehensive Financial Summary
| Metric | Year 1 | Year 2 | Year 3 | Year 4 | Year 5 |
|---|---|---|---|---|---|
| Revenue | $5.0M | $12.0M | $20.4M | $28.6M | $34.3M |
| YoY Growth % | - | 140% | 70% | 40% | 20% |
| Chocolate Revenue | $3.5M | $7.8M | $13.3M | $18.6M | $22.3M |
| Coffee Revenue | $1.5M | $4.2M | $7.1M | $10.0M | $12.0M |
| Modern Trade % | 40% | 45% | 50% | 50% | 50% |
| HORECA % | 35% | 30% | 30% | 30% | 28% |
| E-commerce % | 15% | 18% | 15% | 17% | 20% |
| Export/Other % | 10% | 7% | 5% | 3% | 2% |
| Gross Profit | $1.8M | $5.2M | $9.6M | $14.3M | $17.7M |
| Gross Margin % | 36% | 43% | 47% | 50% | 52% |
| Operating Profit | $0.2M | $2.1M | $5.8M | $9.1M | $12.5M |
| Operating Margin % | 4% | 18% | 28% | 32% | 36% |
| EBITDA | $0.4M | $2.5M | $6.4M | $9.9M | $13.4M |
| EBITDA Margin % | 8% | 21% | 31% | 35% | 39% |
| Net Income | $0.1M | $1.9M | $5.3M | $8.3M | $11.4M |
| Net Margin % | 2% | 16% | 26% | 29% | 33% |
| Cash Flow from Ops | $0.5M | $2.8M | $6.2M | $9.5M | $12.8M |
| Free Cash Flow | -$1.3M | $2.5M | $5.8M | $8.9M | $12.0M |
| ROE | 2.1% | 15.2% | 24.8% | 28.1% | 31.3% |
Financial Performance Dashboard
Currency Risk Management
Given the significant EUR-denominated machinery investment, currency hedging forms a critical component of the investment structure. The recommended approach minimizes foreign exchange exposure while maintaining cost predictability.
EUR/AED Hedging Strategy
- Forward Contract: 3-year EUR/AED forward at 3.97 rate
- Hedging Cost: Approximately $22k (0.6% of machinery investment)
- Risk Elimination: Complete protection against EUR appreciation
- Budget Certainty: Fixed machinery costs in AED terms
Capital Expenditure Schedule
The machinery investment follows a structured deployment schedule aligned with facility construction and regulatory approvals, ensuring optimal cash flow management and operational readiness.
| Investment Phase | Timeline | Amount | Key Milestones |
|---|---|---|---|
| Phase 1: Deposit & Order | Day 30 | €540k ($585k) | Machinery order placement |
| Phase 2: Facility Preparation | Days 31-120 | $650k | Construction and setup |
| Phase 3: Equipment Delivery | Month 6-7 | €1.26M ($1.37M) | Installation and commissioning |
| Phase 4: Working Capital | Month 8-9 | $700k | Operations launch |
Critical Financing Timeline
Emirates Development Bank application must be submitted by Day 14 to ensure approval and fund availability for the Day 30 machinery deposit. Delays beyond this timeline risk 6-9 month equipment lead times pushing production launch to Q4 2026, missing the optimal market entry window.
Working Capital Requirements
The $700k working capital allocation supports initial operations through the revenue ramp-up phase, ensuring adequate liquidity for raw material procurement, payroll, and operational expenses during the first 6-9 months of operations.
Working Capital Breakdown
-
Initial Raw Material Inventory (3 months): $280k
- Cocoa beans and chocolate ingredients: $180k
- Green coffee beans: $100k
- Finished Goods Inventory: $120k
- Accounts Receivable (45-day terms): $200k
- Operating Expense Buffer (2 months): $100k
NPV and IRR Analysis
Investment Return Metrics
Value Creation Drivers
- Revenue Growth: 61.7% CAGR from market penetration and product expansion
- Margin Expansion: Operating margins improve from 4% to 36% through scale and efficiency
- Tax Optimization: Dual entity structure reduces effective tax rate to 2.5% vs 9% baseline ($10.8M savings over 5 years)
- Manufacturing Advantage: 23-31% cost savings vs import-dependent competitors ($3.37M NPV benefit)
- Asset Efficiency: High facility utilization and inventory turnover
Scenario Analysis
| Scenario | Probability | Year 5 Revenue | NPV (12% WACC) | IRR | Key Assumptions |
|---|---|---|---|---|---|
| Upside | 15% | $45.2M | $32.8M | 52.3% | Faster market adoption, GCC exports Year 3 |
| Base Case | 70% | $34.3M | $21.3M | 39.4% | Plan execution, 5.9% SAM penetration |
| Downside | 15% | $20.6M | $8.7M | 21.8% | Slower ramp-up, 3.5% SAM penetration |
Monte Carlo Simulation Results
Success Probability (NPV > 0): 94.3% based on 10,000 iterations
Expected NPV (Probability-Weighted): $19.8M
Risk Assessment: Strong downside protection with positive returns in 94%+ scenarios
Sensitivity: Most sensitive to Year 2-3 revenue ramp-up and gross margin achievement
Board Recommendation
Investment Approval
RECOMMENDATION: Approve $3.5M investment for immediate implementation beginning November 30, 2025.
Rationale: Exceptional value creation with 39.4% IRR significantly exceeding typical investment hurdle rates. Strong risk-adjusted returns with 94.3% success probability. Strategic positioning benefits provide additional non-quantifiable value through market leadership and export platform establishment.
Critical Timeline: Machinery orders must be placed by Day 30 to secure 6-9 month delivery timeline for Q2-3 2026 production launch.